MillMaster run stop diagram downtime - a hidden opportunity
Feature: Run stop diagram
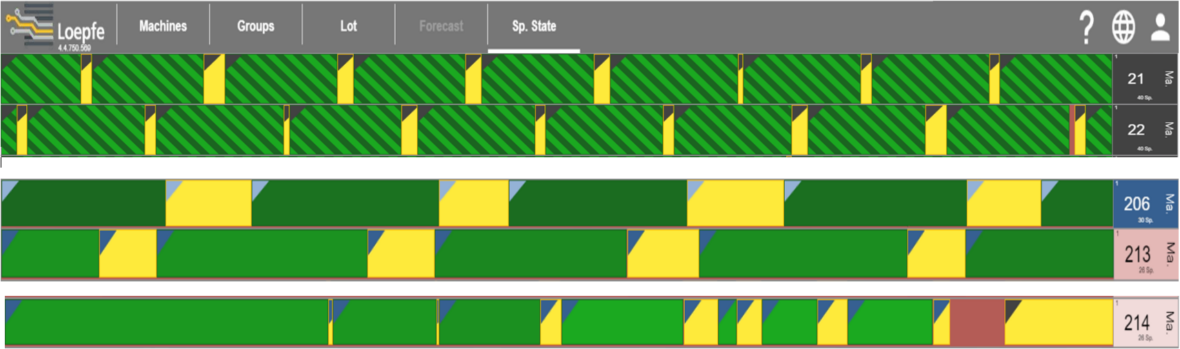
MillMaster TOP provides a precise overview of every single downtime event for each individual winding machine. The “Run Stop Diagram” shows the following interesting facts:
- How long an article or lot change takes
- How long linked winding machines frequently have to wait for full bobbins from the ring spinning machine because of doffing
The waiting times are displayed as yellow bars in the "Run Stop Diagram". The example (Figure 1) shows that machines 206 and 213 are stopped for two or even three hours. These standstills have a considerable negative influence on efficiency.
Solutions & Benefits
Based on this knowledge, two different approaches towards process optimization can be taken. Either focus on the efficiency and adjust the processes of the ring and winding machines in order to reduce downtime to a minimum. Or use the available downtime window to reduce the speed and thus increase the yarn quality, because a lower speed leads to:
- Less hairiness
- Fewer imperfections
- Fewer yarn breaks